Fishbone Diagram
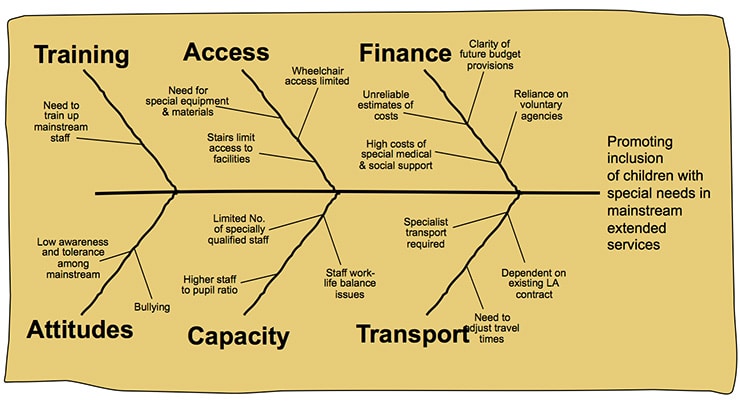
The Fishbone Diagram (sometimes called the Ishikawa diagram) is used to identify all the factors that have an impact on your problem.
✓ Created by former KPMG & McKinsey consultants
What You'll Achieve with the Fishbone Diagram Workshop
Real outcomes that transform your team
Enhanced team collaboration and input from diverse perspectives.
Clear understanding of the problem's scope and factors involved.
Foundation for further root cause analysis techniques.
When to Use the Fishbone Diagram Workshop
Perfect for these situations and team challenges
When a team needs to analyze a complex problem before jumping to solutions.
Before conducting a Five Whys analysis to identify key issues.
How the Fishbone Diagram Workshop Works
A step-by-step breakdown of the workshop process
1Define the problem
The Facilitator writes the problem statement on the right-hand side of the paper.
2Draw the backbone
Draw a straight horizontal line from left to right, pointing to the problem (the fish backbone).
3Add main stems
Draw angled stems branching from the backbone at about 45°.
4Identify key factors
After group discussion, agree on 5–6 key factors or headings that contribute to the problem. Write one at the end of each stem.
5
Key Topics Covered in the Fishbone Diagram Workshop
Ready to run workshops that create real change?
Two ways to get started:
Choose the path that works best for you
Do it Yourself
Perfect for facilitators, leaders and managers
- Instant access to sample frameworks