The Fishbone Diagram (sometimes called the Ishikawa diagram) is used to identify all the factors that have an impact on your problem.
It is primarily an issue analysis technique but it also has a motivational and team building effect on participants as they go through the process.
There’s nothing like building a shared understanding of a tricky problem to unite a team.
The process is called Fishbone Diagram because of the way in which the information gathered is arranged visually – like the skeleton of a fish.
Objective
- To identify the scale and scope of issues and problem areas in any change process.
When Would You Use It?
- This is primarily a group problem analysis technique, but can be used by individuals as well.
- Can be used just before a 5 Whys Analysis where one of the highlighted issues is targeted for further root-cause analysis.
Why Would You Use It?
- The Fishbone Diagram captures and collates all the different perspectives in the room that relate to the issue at hand. Hence it is ideal when the group comprises people from different backgrounds or professional disciplines. Everyone is then able to bring their perspective into focus and the team is better informed on what is involved.
- Without such analysis, teams can often move into “fix it” mode before they really understand the scope or scale of a problem or issue. Often this means they end up addressing only part of the problem and either the problem remains or it reappears in another guise.
Resources Required
- 30-45 minutes.
- 4-10 people.
- An open space (no chairs and tables).
- A large piece of paper stuck on the wall.
- Marker pen (plus some for spare).
- A facilitator.
Process
- The Facilitator writes down the problem on the right-hand side of the paper.
- The Facilitator draws a straight line to the left (like the backbone of a fish).
- The Facilitator draws stems at a 45° angle to the backbone line.
- After discussion and agreement with the Participants the Facilitator, at the end of each of these stems, lists 5 – 6 key factors /headings of the problem or issue that can be brainstormed.

- Each of the key factors can then be broken down into subsidiary factors that need to be understood before moving on to solutions in the development phase.
- The Participants should be encouraged to brainstorm each main ‘bone of the fish’ in turn.

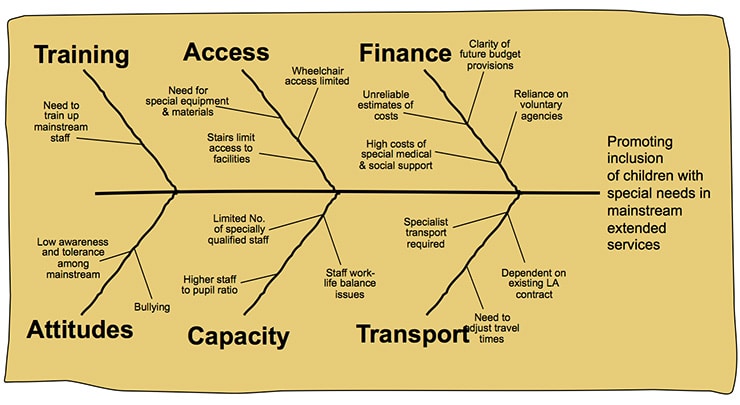
A completed Fishbone Analysis
Secret Sauce
- Instead of a facilitator leading the discussion on each branch give a member of the team responsibility for facilitating the brainstorming of one main bone. That way it becomes a team-building exercise also.
- Keep the group away from discussing possible solutions. The temptation is always there to jump into solution-mode but it’s important people see the whole picture first before getting into fixing things.
- The ‘key factors’ along each of the stems can often be categorized depending on the situation using one of these standard models:
- The 6 Ms (used in manufacturing: Machine, Method, Material, Man Power, Measurement and Mother Nature).
- The 7 Ps (used in marketing: Product / Service, Price, Place, Promotion, People / personnel, Positioning, Packagings).
- The 3 Ss (used in service: Surroundings, Suppliers, Systems, Skills, Safety).